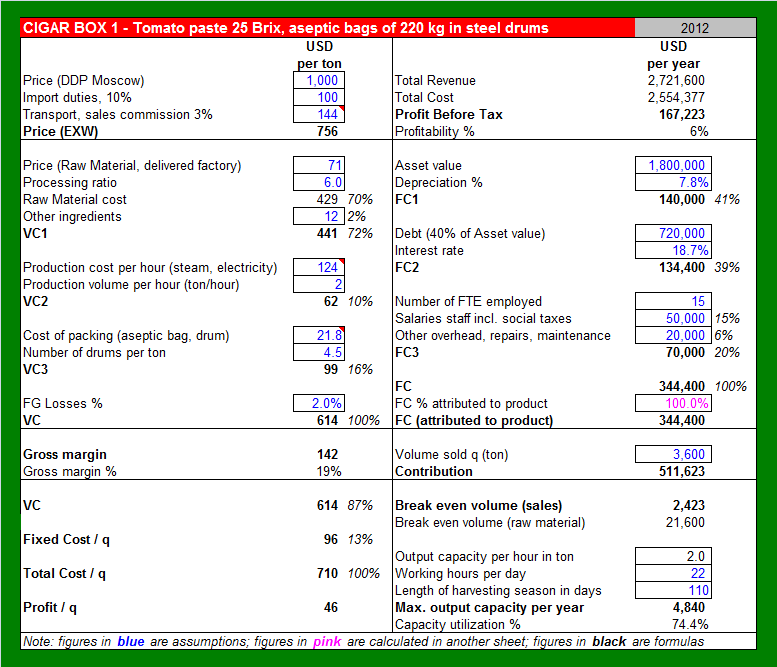
CB1 calculates cost price, gross margin, contribution and break-even of a single product. With 24 figures, to be entered in the spreadsheet boxes below, a complete picture is obtained of the profitability of a product. Scenarios and sensitivity analysis can be carried out by simply changing a number in a box. The percentages can be used to benchmark the cost price: are we cheaper, or more expensive than our competitors?